Multiple Regression: Caso de Estudio
Aca presentamos un ejemplo de un caso de estudio de Regresión Múltiple. Hay bastantes elementos que son necesarios para llevar a cabo un análisis de regresión exitoso. Ante todo, es fundamental elegir la tipo funcional del modelo apropiadamente. Después, es crucial que el modelo satisfaga los supuesto de la regresión lineal.
Estas dos condiciones previas van de la mano. Es decir, despues de elegir un tipo funcional, los supuestos del modelo deben chequarse, y si no son satisfechas, deberá probablemente cuestionarse si el model es apropiado, o si una funcion link diferente debe usarse, o si es que una ridge-regression necesita ser aplicada, entre otras medidas que pueden tomarse.
Las sutilezas son muchas, y un ojo experto es requerido. Hay una cosa muy importante a tener en mente: tener un modelo de regresión estimado por un paquete estadístico no significa que el modelo necesariamente satisface los supuestos ni que el modelo es útil.
El siguiente caso de estudio está presentado en Inglés, pero todos nuestros reportes pueden ser presentados en Inglés o Castellano, a opción del cliente.
A Multiple Linear Model for Life Expectancy
Abstract
A multiple linear regression model is constructed in order to predict Life Expectancy. Five possible predictors were considered and using stepwise regression the final model consisted of only two predictors: Human Development Index and Index of Democratization.
1. Introduction: A theoretical Approach, Argument and Hypotheses
The objective of this paper is to obtain a multiple linear regression model for Life Expectancy, based on the predictors found in the cs2003 comprehensive.sav SPSS dataset. For the purpose of the analysis, the following predictors will be used in a multiple regression model for predicting life expectancy: Human Development Index, Unemployment (% total labor force), Democratization, Hospital Beds per 1000 people, Health Expenditure (% GDP) and Urban Population (% of total).
All of these variables are expected to reasonably affect the average life expectancy of a country and for this reason they are going to be included in the model, or at least, they will be attempted to be included. Then, by a process of model building, the best model containing the above mentioned variables will be constructed, by using the following principles: parsimony, maximum explained variance, and smallest standard error. For the purpose of testing the validity of our model, four cases will be held for testing purposes. The holdout countries will be Marshall Islands, Palau, Micronesia and Samoa
2. Descriptions of Data, Indicators and Slippage
For the purpose of the analysis the SPSS file the cs2003 comprehensive.sav will be used. This file contains 235 variables and 212 cases, corresponding to the countries in the world. The variables included the dataset are many demographic and macroeconomic variables that put together can give a very good idea of the metrics of any given country.
3. Analysis of Findings
The purpose of this section is to fully describe the results of a regression analysis performed in order to address the research question stated in the previous sections. First, the possible linear correlation between the dependent variable (DV) Life Expectancy and the predictors is assessed.

As it can be observed above, all five predictors have a significantly and positive degree of linear association with the DV.
Now graphically:

There is a clear degree of linear association between the DV and the potential predictors, which confirms the results obtained in the correlation matrix.
Now that we know that the predictors have a significant linear association with the response variable, a multiple linear regression analysis is performed:

It is observed that the model is significant overall, F(6, 29) = 21.821, p < .001. The model seems to have a good predictive value, since considering that 78.1% of the variation in Life Expectancy is explained by this model. There are no problems with multicollinearity, since all the VIF’s are lower than 5. But we also observe that not all predictors are individually significant. In order to drop the redundant predictors a stepwise regression will be performed.

Observe that only 2 variables enter to the final model: Human Development Index and Index of Democratization. Such model explains 78% of the variation in Life Expectancy. The model is:
Life Expectancy = 33.928 + 51.842*Human Development Index -0.128*Index of Democratization
The following residual plots are obtained:
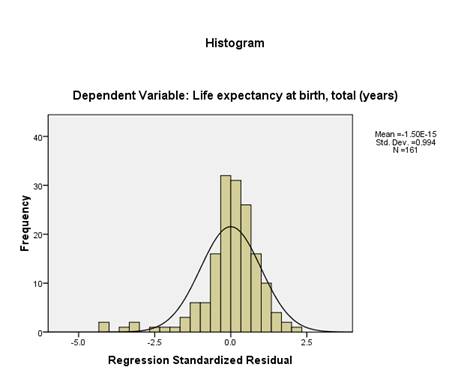
The histogram of residuals doesn’t seem to show any strong violation from normality.

The plot of residuals versus predicted values above doesn’t show any pattern suggesting any kind of problem with heteroskedasticity. The regression assumptions seem to be met.
4. Conclusions and Policy Implications
First of all, it is important to point out that the dataset exhibited a whole lot of missing values, which is something that could be worrisome for the validity of the conclusions of this analysis. In fact, out of 212 cases, only 30 turned out to be valid to perform the regression analysis. It wad found that only 2 variables entered to the final model: Human Development Index and Index of Democratization. Such model explains 78% of the variation in Life Expectancy. The model is:
Life Expectancy = 33.928 + 51.842*Human Development Index -0.128*Index of Democratization
Hence, and increase of 0.1 in the Human Development Index brings and average increase of 0.51842 years in life expectancy, whereas an increase of 1 point in the index of democratization decreases an average of 0.128 years of life expectancy. Overall, the model found seems to be reliable, with a higher percentage of explained variation (78%) and apparently the regression assumptions are met. One possible flaw is that number of valid cases for the regression analysis was quite (low), which could eventually affect the validity of the results.
References
Gravetter, F. & Wallnau L. (2005). Essentials of Statistics for the Behavioral Sciences. Wadsworth.
Mertler, Craig A. & Vannatta Rachel A. (2002). Advanced and Multivariate Statistical Methods. Los Angeles: Pyrczak Publishing.
Kutner, M et al. (2004). Applied Linear Regression Models. New York, McGraw-Hill Irwin.
Appendix
Checking the validity of the model using the holdout data:
The dataset contains a lot of missing values, so the original countries considered for being holdout countries don’t have the required variables to perform the estimate of life expectancy. Hence, we choose 3 countries that contain all valid cases, required to use the regression model obtained:
|
Life Expectancy |
Human development Index |
Index of Democratization |
Predicted Life Expectancy |
Error |
Abs. Error |
%Error |
|
79.1463 |
0.933 |
27.4 |
78.7894 |
0.3569 |
0.356914 |
0.45% |
|
68.8402 |
0.659 |
16.8 |
65.9415 |
2.8987 |
2.898722 |
4.21% |
|
62.4597 |
0.594 |
23.8 |
61.6757 |
0.7840 |
0.783952 |
1.26% |
|
MAPE = |
1.97% |
The mean average percent error is 1.97%, which indicates that the model is valid.
Llámenos para una consulta inicial al (+56) 9 76209580 entre 10am y 8pm.
O envíenos un correo electrónico para con una descripción de su situación específica, y le responderemos a brevedad con una propuesta de como podemos ayudarlo.
Queremos discutir su negocio y procesos en detalle, para analizar que mejoras pueden ser obtenidas basado en los datos disponibles.
Análisis de Datos
Usamos el poder de los datos estadísticos para obtener poderosas conclusiones.
Reportes
Proporcionamos completos y detallados reportes de nuestros proyectos, con la profundidad requerida por el cliente.
Resultados
Usamos poderosos modelos para alcanzar conclusions y predicciones.
Flexibilidad
Nos adaptamos fielmente a las necesidades de nuestros clientes. Podemos automatizar y proporcionar soluciones custom.
Nuestra Filosofía
Rápida Respuesta
Nuestro objetivo es mantener una fluida y pronta comunicación con el cliente con el proposito de avanzar a pasos sólidos hacia la materialización de los objetivos del proyecto.
Softwares Estadísticos
Tenemos expertise en la mayoria de softwares estadisticos del mercado, y de la misma forma podemos programar soluciones a la medida del cliente
Reportes
Ofrecemos reportes flexibles para satisfacer los requerimientos del cliente.
Consulta Inicial
Queremos discutir sus necesidades de optimizar sus procesos para mejorar su productividad. Presentenos su caso especifico y le proporcionaremos una propuesta sin ningun compromiso
Precios Modulares
Nos especializamos en proveer soluciones efficientes, poniendo énfasis en la modularidad para mantener los precios a le medida de cada presupuesto
Llámenos!
Llámenos y discutiremos sin compromiso como mejorar su productividad